Stable value is a principal preservation investment option used by millions of plan participants to achieve their desired risk tolerance in asset allocation. Stable value investment options are managed in four ways: individually managed accounts, pooled funds, insurance company general accounts, and insurance company separate accounts. No matter the type of management, all have a contractual element that protects against interest rate volatility in order to provide plan participants with safety, liquidity, and attractive returns.
This document provides an overview of the different management types, their performance, and the contract types used to deliver stable value’s guarantee. The information in this document is not exhaustive of the characteristics or differences among these market segments.
Stable Value Assets Totaled $936 Billion as of 12/31/2022
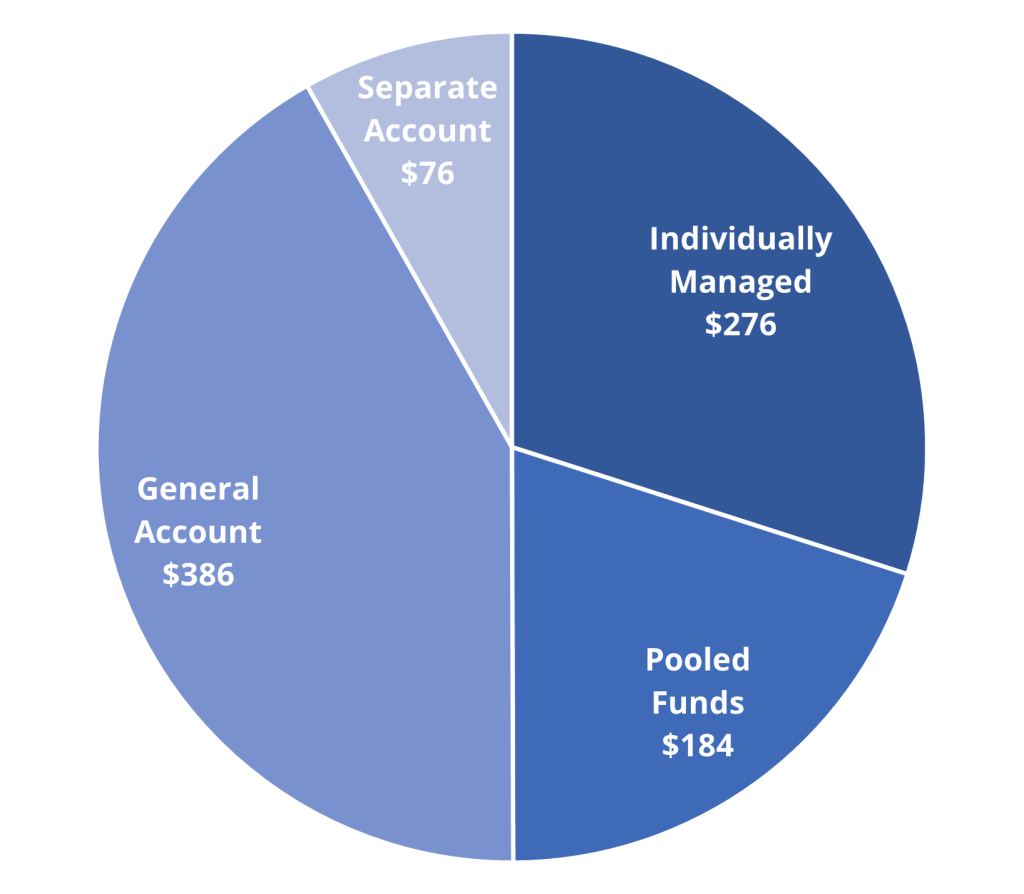
| Individually Managed Accounts | Pooled Funds | General Account Products | Separate Account Products | |
|---|---|---|---|---|
| WHAT IS IT? | Typically offered by an investment manager and managed for a specific plan’s participants. | Typically offered by an investment manager and combines the assets of unaffiliated plans into one fund. | Offered and guaranteed by a single insurance company and backed by their general account. | Offered and guaranteed by a single insurance company from a separate account. |
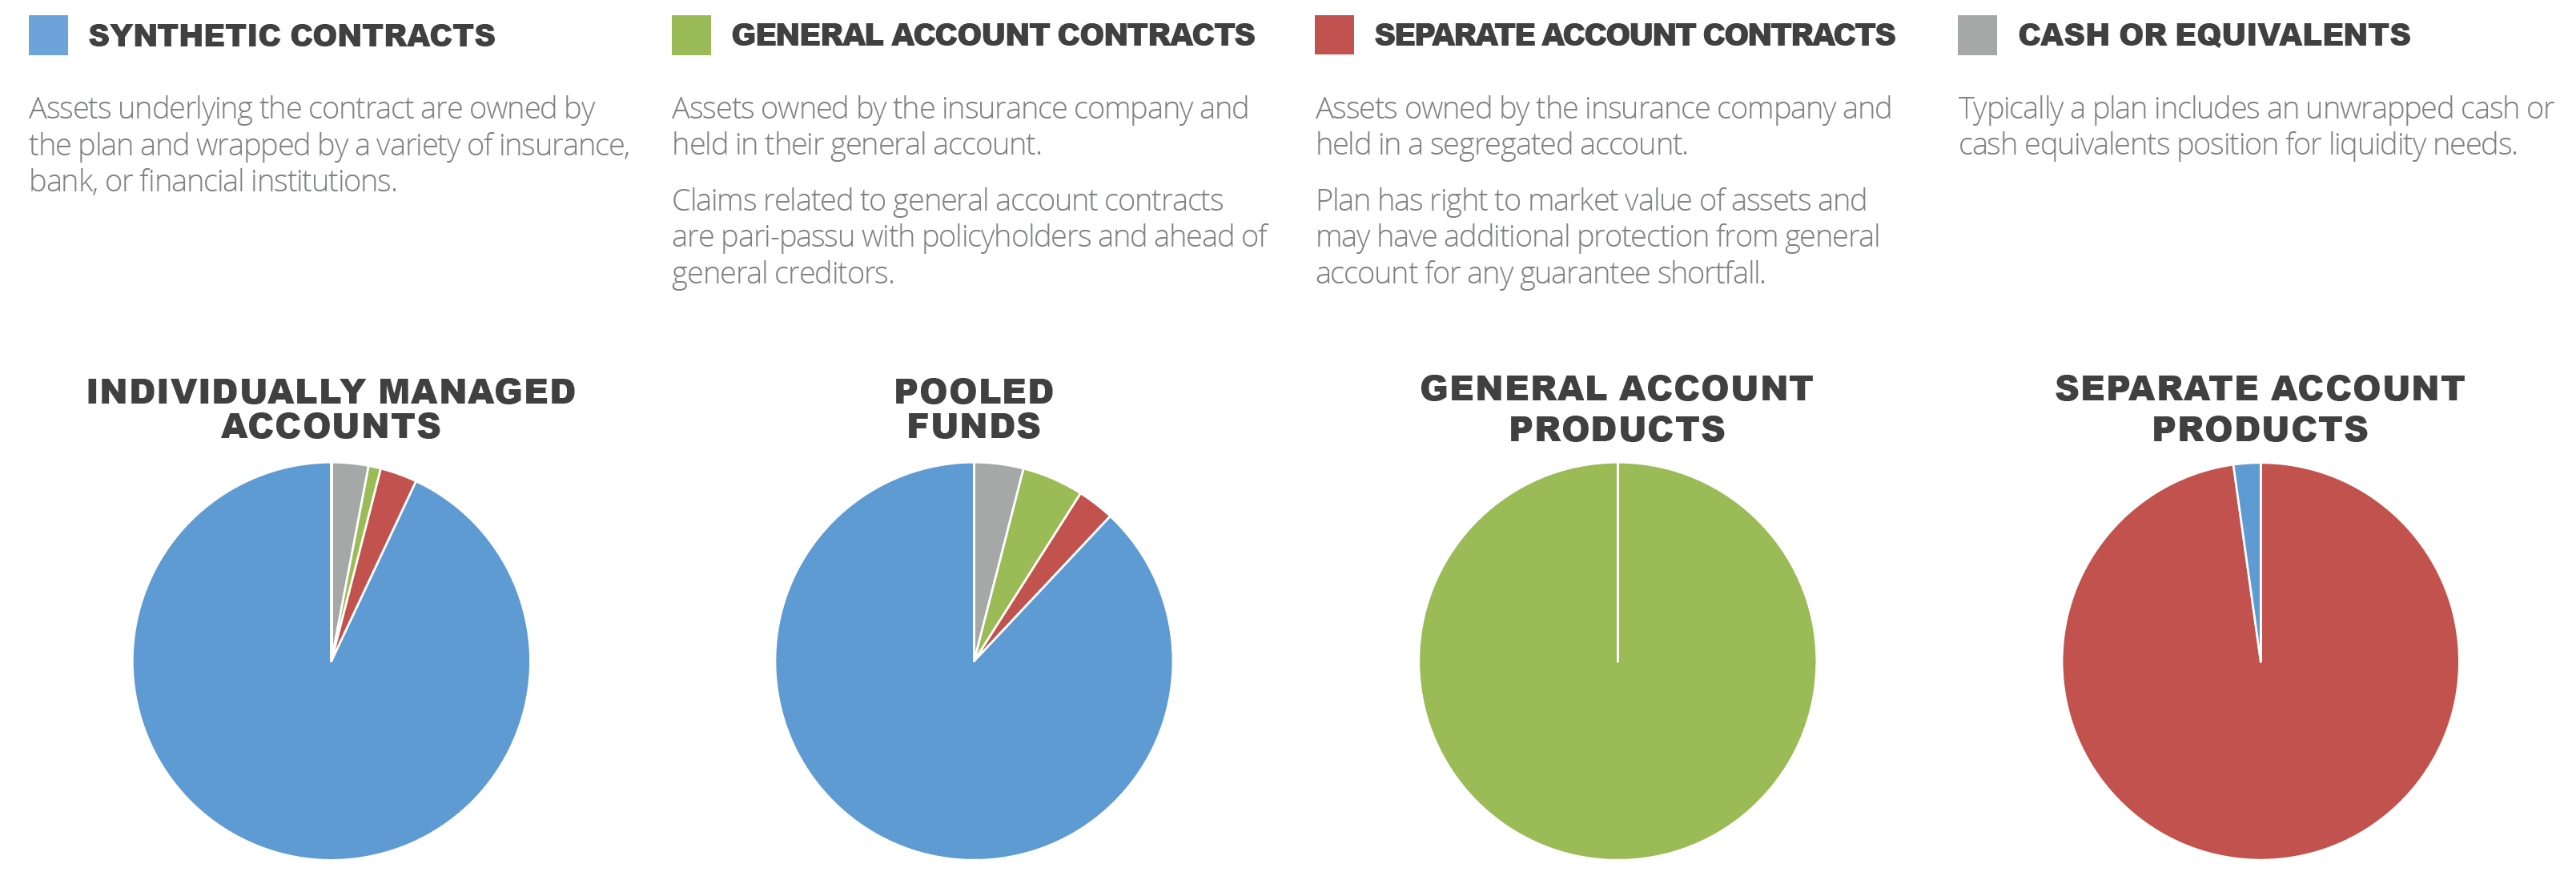
| HOW IS THE PROTECTION PROVIDED? | Diversified across multiple issuers through the use of synthetic contracts, separate account contracts, and insurance company general account GICs. | Issued and guaranteed by a single insurance company. | ||
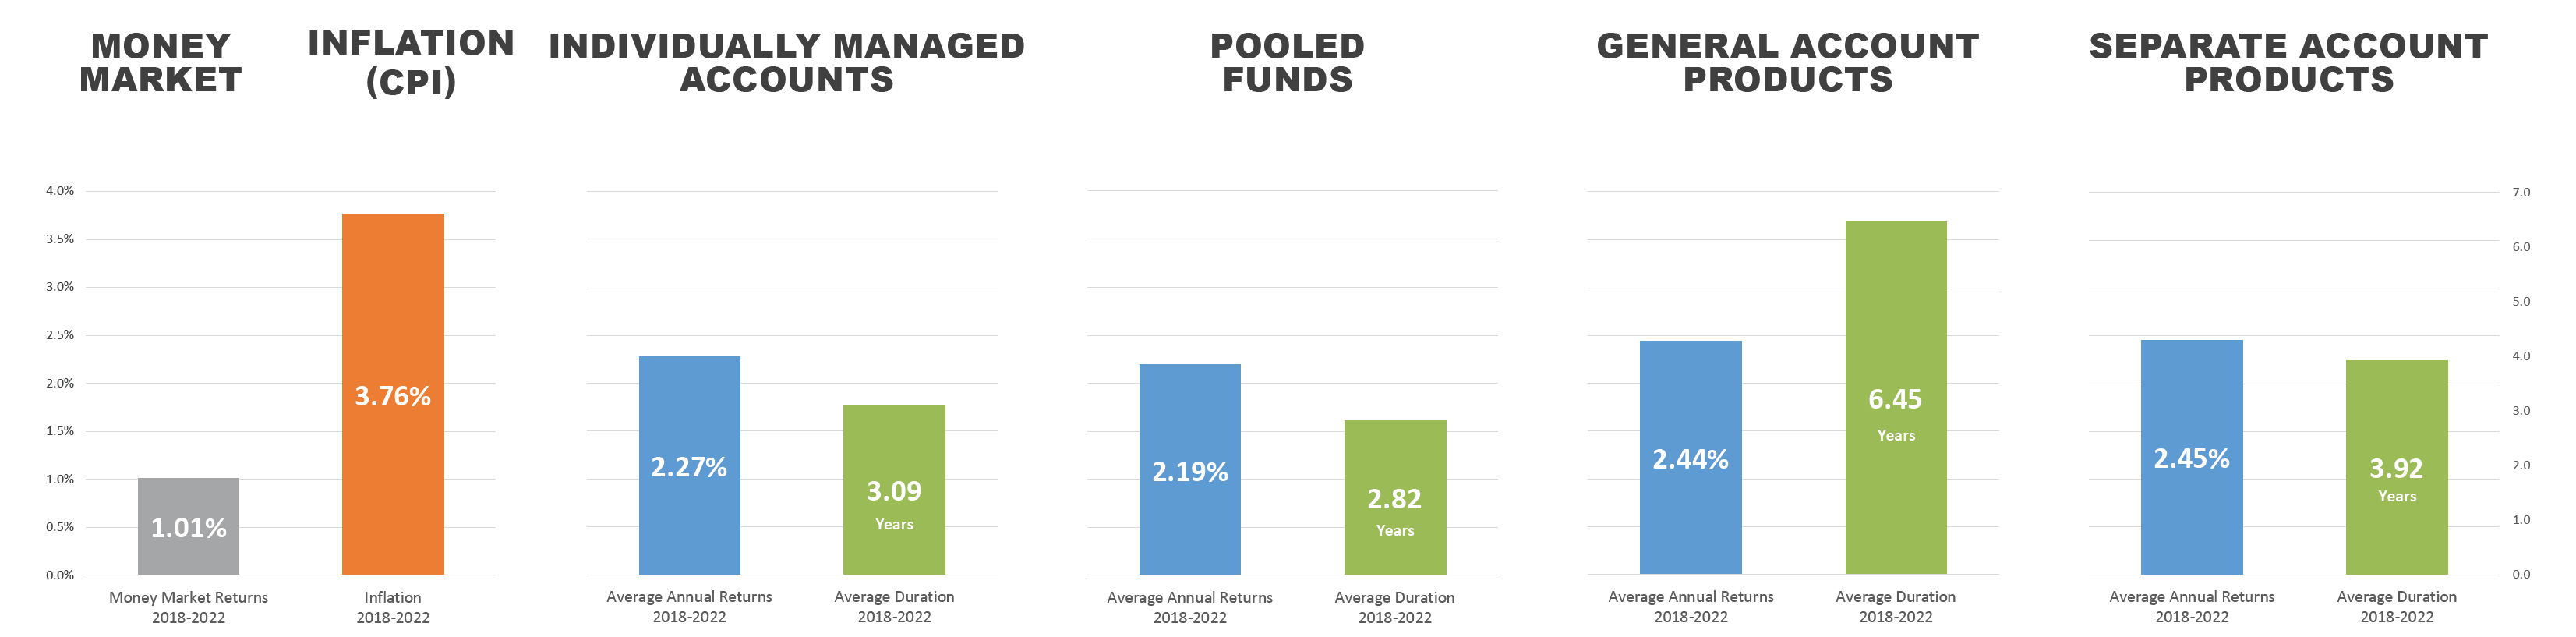
5 Year Performance
Note: Past performance does not guarantee future results.
Contract Types
Characteristics
| Individually Managed Accounts | Pooled Funds | General Account Products | Separate Account Products | |
|---|---|---|---|---|
| Asset Ownership | Plan. | Plan. | Insurance company. | Insurance company, but set aside for the exclusive benefit of the plan. |
| Customization of investment strategy | Fully customizable to meet the needs of the specific plan subject to issuer approval. | No. | No. | Fully customizable to meet the needs of the specific plan subject to issuer approval. |
| Transparency into underlying holdings and performance | Full transparency into underlying holdings and investment performance. | Full transparency into underlying holdings and investment performance. | No. | Typically disclosed, but this varies by product. |
| Exit provisions | Termination at contract value initially set to the duration, but may extend until MV/CV equals 100%. Termination at market value at any time. | Termination at contract value after a deferral period, often called a put option. Deferral periods vary but are generally 12-36 months. | Varies by contract but is often several years; may require structured payout over multiple years. | |
| Fees/spread | Fee based products; disclosed with breakdowns available. | Spread based product, compensation is the difference between actual investment earnings and declared rate1 and is not required to be disclosed. | Varies by product, some are spread based and others are fee based. | |
| Rates | Based on the actual performance of the underlying assets. 0% floor guaranteed. | Declared in advance; guaranteed regardless of the performance of the underlying assets. | Can be either tied to investment performance or declared and guaranteed in advance. | |
| Average duration2 | 3.31 years | 3.05 years | 6.09 years | 3.99 years |
| Average credit quality range3 | AA- through AA+ | AA- through AA+ | A- through AA | A- through AA |
| Issuer default | Underlying assets are owned by the plan and retain their market value. Defaulted issuer exposure may be reallocated to another issuer. | Claims against assets in the general account; pari-passu with policyholders and ahead of general creditors. | Claims against assets in the separate account and then, to the extent necessary, by the insurer’s general account. | |
| Average plan size4 | $709.4 million | $4.4 million | $335.1 million | $95.4 million |
Disclaimer: The observations and data contained in this fact sheet are intended to be illustrative in nature to give an overview of the stable value industry, as well as to provide relative trend information. These observations and data are reflective of the reporting or survey period only and, as such, are subject to change. This information may not be reflective or applicable to a specific plan’s stable value investment option or a specific stable value fund. Further, these observations and data are not intended to constitute nor represent a benchmark. SVIA surveys are an exclusive benefit of membership. Data is confidential. Use of data for external purposes requires the express permission of the association.
1 – Investment returns need to be greater than the rate credited to generate profit. If the investments underperform or if any of the assumptions are inaccurate, the insurer is still held to the declared credited rate and the guaranteed minimum rate.
2 – SVIA Stable Value Quarterly Characteristics Survey for 4Q2022
3 – Ibid
4 – SVIA 2022 Stable Value Investment and Policy Report